
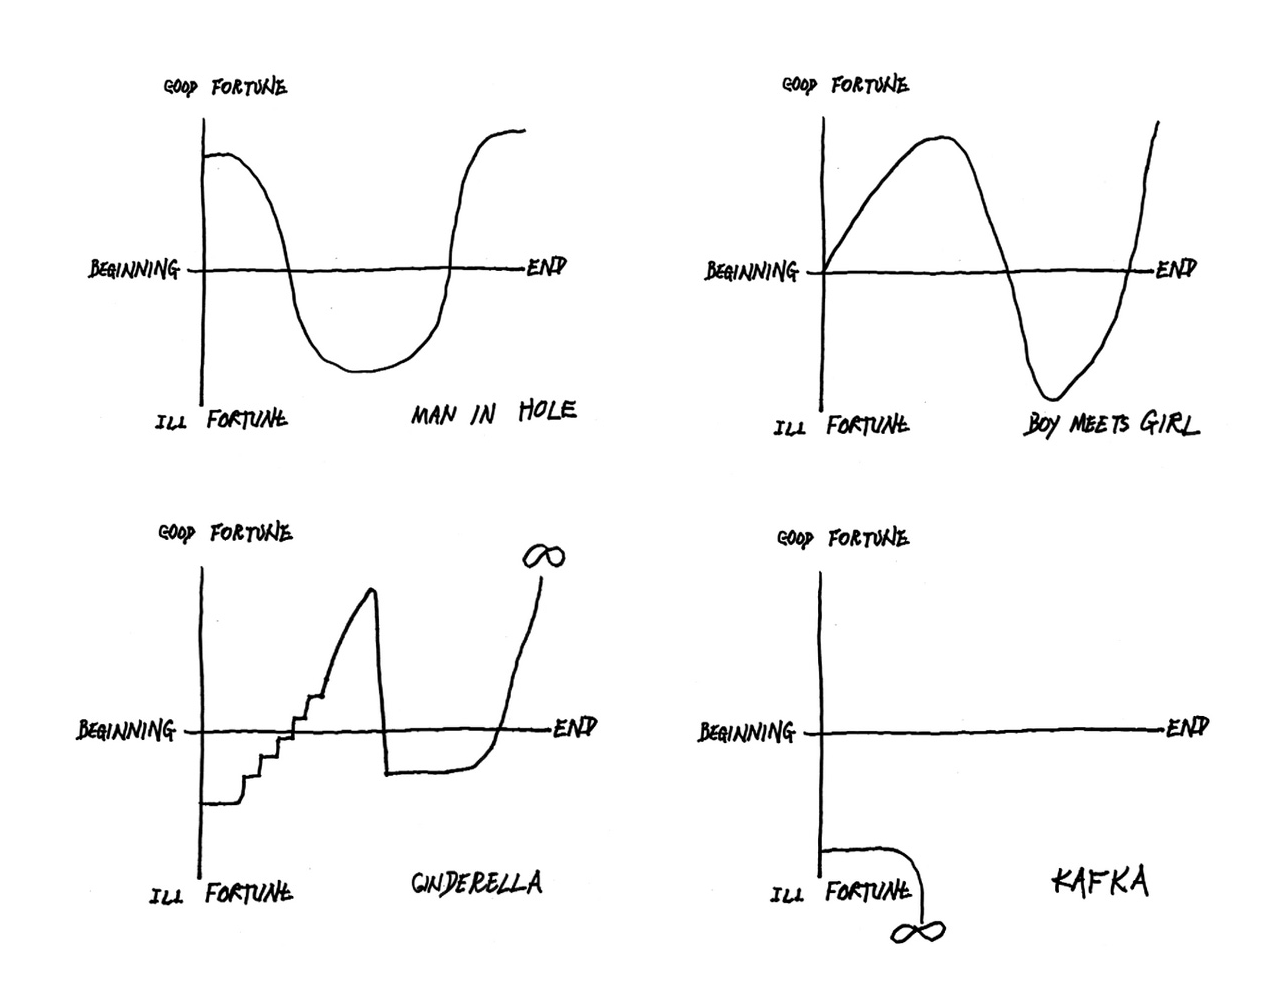
Some of Vonnegut’s story shapes. The Kafka one probably isn’t a great arc for a presentation.
Kurt Vonnegut once said “stories have shapes which can be drawn on graph paper, and that the shape of a given society’s stories is at least as interesting as the shape of its pots or spearheads.” This was the idea behind his Anthropology master’s thesis, which the University of Chicago rejected. He also wrote a short story called “The Big Space Fuck”, so he was probably what HBR would call a “domain straddler.”
Setting aside the huge potential of studying stories (or also jokes) as a way to better understand a culture, Vonnegut’s story shape idea is also extremely useful when it comes to writing a presentation.
As we know, information alone isn’t enough to make people do something. That information has to be wrapped in a relatable narrative, ideally with some tension in there (more on tension in another post). But, when you’re preparing a presentation it’s very hard to weave a collection of insights – or a strategic roadmap, or a new positioning idea – into anything that feels like a story. Often you’re left with what feels rather more like an unpacked list, maybe in chronological order of discovery or contingency or whatever. It’s no summer blockbuster. Worse still, it’s probably made of slides.
This is where a completely analogue activity can help you, and it comes from applying what Vonnegut does in this lecture:
You will need:
• Something to draw on
• Something to draw with
• Sticky notes with your ideas/insights/recommendations written on them
1: Draw the X and Y axes. Remember X runs across the middle, not along the bottom.
2: Label your axes. Beginning to end on X, bad to good on Y. In this case Vonnegut’s good and Ill fortune apply to the client’s brand, or maybe to a persona if you’re talking about user experience.
3: Take your notes, and think about where they belong on the graph. Are they expositions of ill fortune for the brand, or routes to good fortune? Are they contextual (near the beginning) or focussed (near the end) Consult Vonnegut’s different story shapes and think about what would work best for your client in terms of helping them engage. Is there a story shape which mirrors something the brand has been through before? Is there a shape which mirrors the story of a notable figure from the client organisation, or a particularly captivating participant in some research? You want to give the story some kind of curve because the movement from bad to good – or good to bad – will help to hold your audience’s attention.
4. Move your notes around accordingly. As we all know, one of the acts that makes you most feel like a strategist is moving a sticky note to a new place.
You want to end your story in the top right corner. In an ideal world you’re looking for Cinderella levels of off the scale happiness for your client, but often an “and that’s how you get out of this mess” ending is more realistic. But, that’s ok because, as Vonnegut says, it’s “an exercise in relativity, it’s the shape of the curves that matters, not their origins.”
The top right corner – ending up in good fortune – is just a case of things being better for the brand in the future than they are right now. Even if the brand is Vonnegut’s “man in the hole” and the story doesn’t end with getting out of the hole, you need to at least end the story by showing how make the hole a nicer place to be.

